Free map reading guides
Understanding contour lines and relief on a map is essential for safe planning and navigation across the varied terrain you may encounter on your outdoor adventures. This guide explain all you need to know about contours and help you read valley and ridge contour lines, slopes and spurs on an OS Map map.
We’ll assume you’re already comfortable understanding how contours printed on a map represent the real world – if not have a quick look at our beginner’s guide to contours first.
In brief, a contour line is drawn between points of equal height, so any single contour line will be at the same height all the way along its length. The height difference between each contour line is known as a contour interval and depends on the map being used. For most OS Maps it is normally 10 metres, but it can be 5 metres in flatter areas. The map key will tell you the contour interval used.
Visualising contours and relief
In remote and difficult terrain man-made features can often be rare. It’s also possible a man-made feature, such as a log cabin, can be added or removed from the landscape. Since natural features don’t change as quickly or easily as their man-made counterparts, being able to use them to navigate is essential.
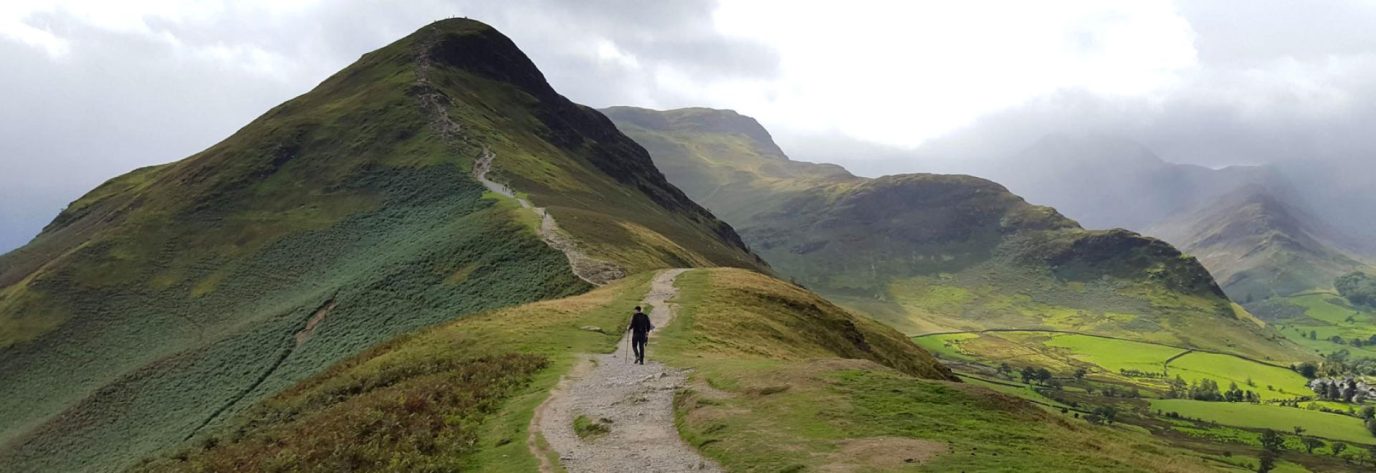
Being able to visualise the contours easily gives you many more points that can be used for triangulation, as you can use otherwise unmarked hill crests, the line of a hillside or the drop into a valley.
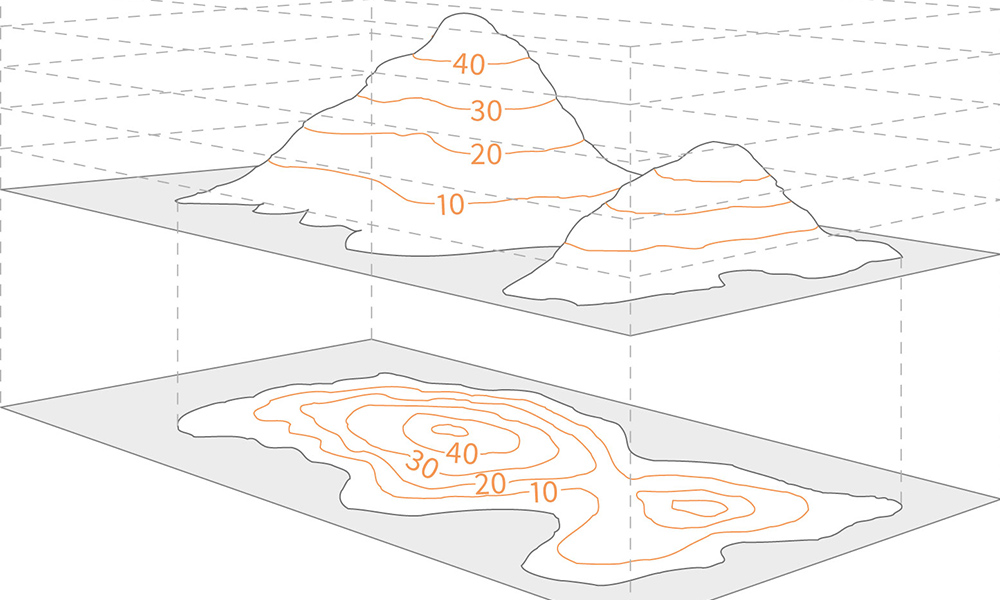
Being able to picture contour lines on a flat map lets you ‘see’ terrain
Some people find visualisation very easy, while others find it considerably harder, but almost everyone can do it with practice. One way to teach it is to imagine the contour lines as high tide lines left by the sea. As the water level drops it would leave a line every 10 metres on the landscape.
Which way up should you read contours?
Ideally you don’t want to actually read all the contour lines labels to understand the terrain. In crowded areas the numbers can be quite a long way from the feature you are trying to view, and trying to find and read the tiny writing can be a pain, especially in poor weather.
However, this can make it easy to read it in reverse – valleys looking like ridges, or hills like dips.
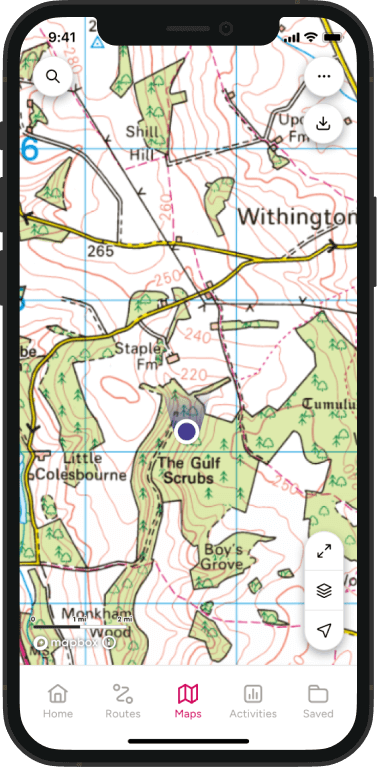
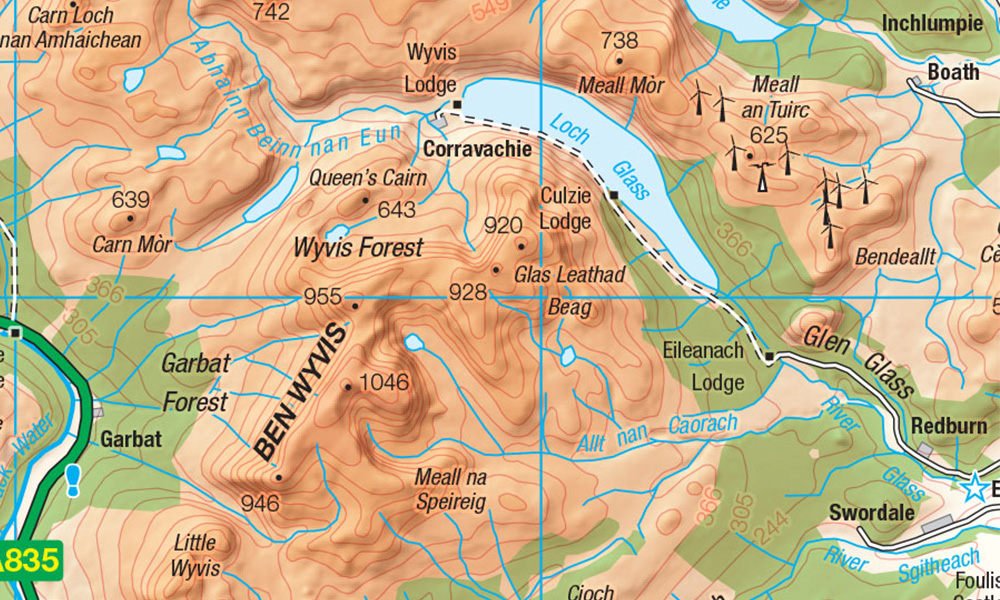
One really obvious way is that streams are usually at the bottom of valleys, not on ridges, and tend to get larger as they go downslope. If you are an area near the tree line you can also easily see the difference between bare hill tops and valleys with distinctive green shading. You will also notice all the numbers on countours are aligned with the top of the number uphill – meaning you can see slope direction without having to actually read the numbers.
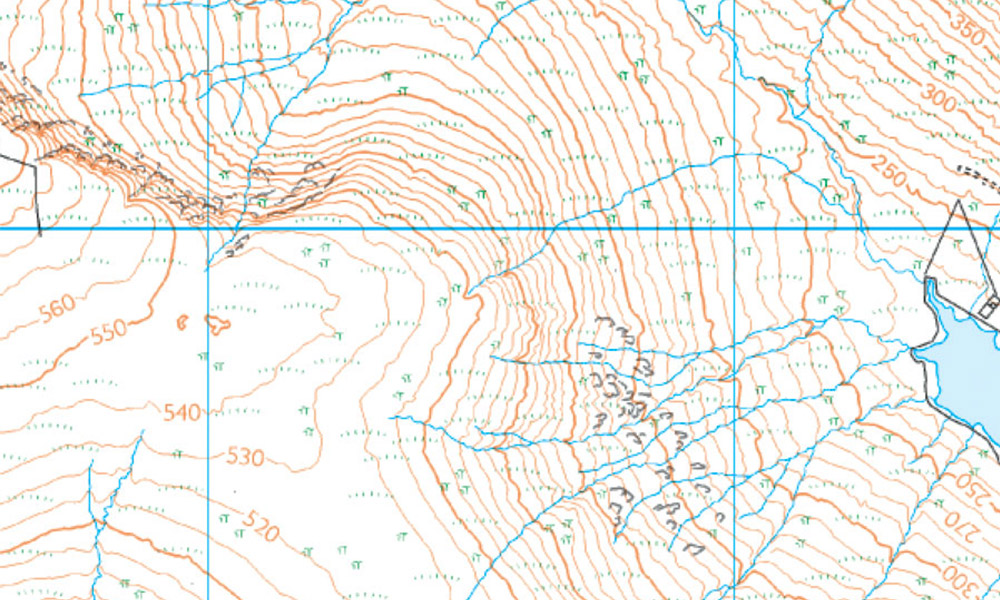
The steams going to the reservoir and the lack of tree cover make is easy to see this is a peak on the left with a steep valley to the right. Note how the numbers point ‘uphill’
Some map styles make this much easier for you by using hill shading, drawing shadows to create a 3D effect. The biggest problem with hill shading is that it tends to obscure or replace the contour lines, making it harder to work out accurate height data. However, for activities where this is less critical (such as driving or road cycling) using a map with hill shading instead of contours can be a good choice.
Hill shading, such as on this OS Road map, can make visualising hills much easier but can also obscure features
Identifying features on a map
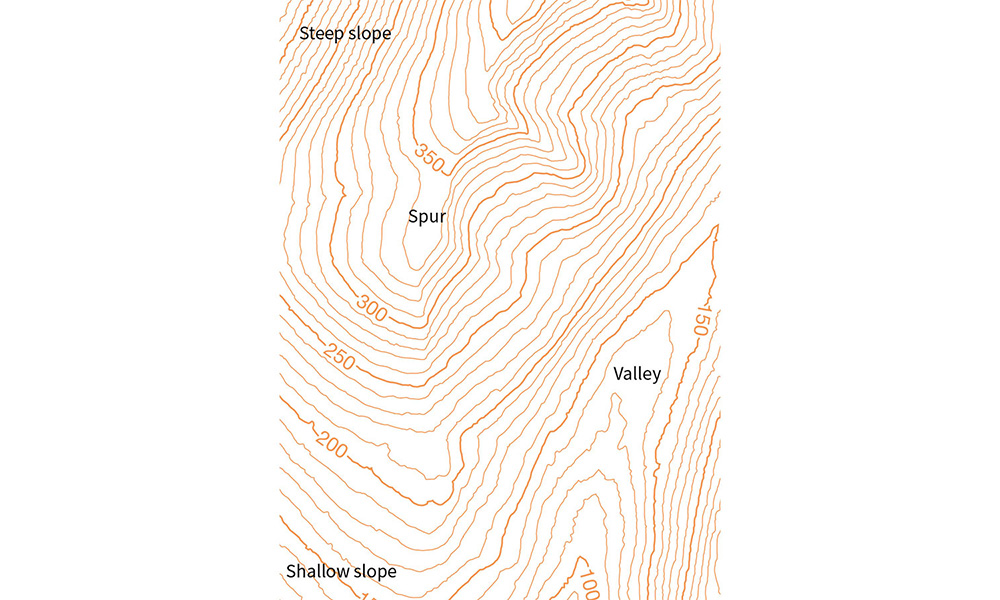
The below picture shows how contour lines can be used on maps to describe different landscapes. Even though all the lines look similar at first, they are describing very different landscape features. The closer together the contour lines, the steeper the slope of the hill. If a hill is very steep the contour lines might even merge into each other.
A spur is a ‘V’-shaped hill that juts out. A simple way to tell a valley from a spur when looking at contour lines is to remember that if the ‘V’ points uphill it’s a valley, if it points downhill it’s a spur.
Contours bunched together on either side of lower, more evenly spaced contours show a valley or col between two areas of high ground.
Some features shown in contour lines
Small downward lines inside a contour circle are known as ‘hachure marks’ and signify ground that is sunken beneath sea level (not shown on this sample map).
In this image you can clearly see two different types of contour lines. For this scale, bolder lines are numbered, and are every 50m of vertical height. Between each bold contour line there are lighter intermediate ones. These are generally not labelled.
To calculate the height of one of these intermediate contour lines, you can either work it from the map, or check the key. In this case there are four intermediate lines between 250 and 300m, so each line represents 10m of height.
Working out slopes
Contour lines can also be used to work out quite precisely how steep a slope is. This is really useful in the planning stages (especially for walking or cycling) as steep slopes can have a significant effect on estimated times.
First of all, you need to understand the map scale. Now use a ruler or romer to measure the distance on the map the slope covers and calculate the real distance according to the scale.
Next, over the same distance, work out the height change by subtracting the lowest contour value from the highest.
Now you have a height and distance. Divide vertical height by horizontal distance to give a slope steepness. This can be expressed in different ways:
1 metre climb for 10 metres travel
10% slope
1/10
5.7 degrees (approx)
Are a rule of thumb, anything over 15% is steep for cars and road cycling, over 25% is a tough walk in either direction. Remember that the slope will not be totally constant, so parts are likely to be far steeper than others.
Using contour lines for navigation
Using contour lines for navigation
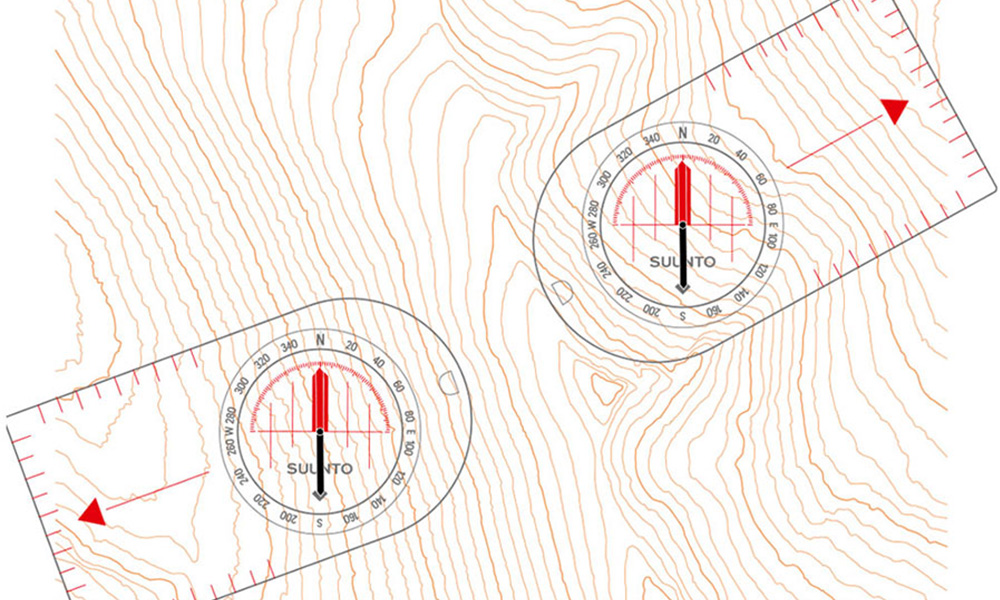
If you’re lost, slopes can often provide vital clues to help pinpoint your location. You will need to know which km square on the map’s grid you are in. Stand facing directly down a slope, imagining you are at 90º to the contour lines of the slope. Using your compass, take a reading of the direction the hill is sloping in and make a note of the reading. This reading is known as the ‘slope aspect’.
Looking at the km square on your map, try to find a slope that faces in the same direction as the reading you’ve just taken. This will help you to establish an approximate location. Taking back bearings will also help. To improve accuracy, walk to another nearby slope, take another reading and then look for this on your map. If you come across a distinguishing feature, such as a spur or valley, measure its slope aspect and look for it on the map. This will help you narrow down or even pinpoint your location. Measuring the aspect of slope is particularly useful if you are lost and find yourself in a bowl or on the end of a spur or ridge.
Using a contour line to find a route
When planning your route on a map it pays to remember that the straightest line between your starting point and destination may not be the easiest, quickest or safest. Examine the map of the area you are walking in very carefully before planning a route. If you are going to be walking in mountainous or rough terrain it is often a good idea to plan a route following contour lines. This is called ‘contouring’.
Contouring is used in hills or mountain areas helps you keep your pace up and make navigation easier. Once you reach a height that’s easy going (out of low-lying bogs and off windswept peaks) you walk along the slope, but keeping at the same altitude. In effect, you are following a path defined by a contour line at a fixed height.
By doing this, you improve your chances of continuing with reasonably easy terrain and make it much easier to follow your position on the map, or find a feature that lets you establish your position. You also avoid energy-sapping ascents and descents.
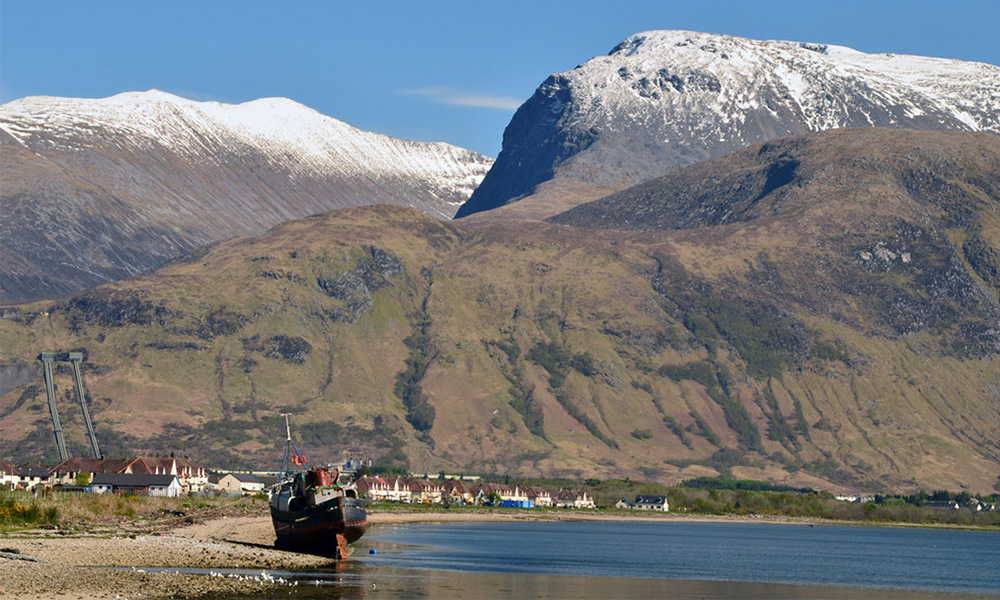
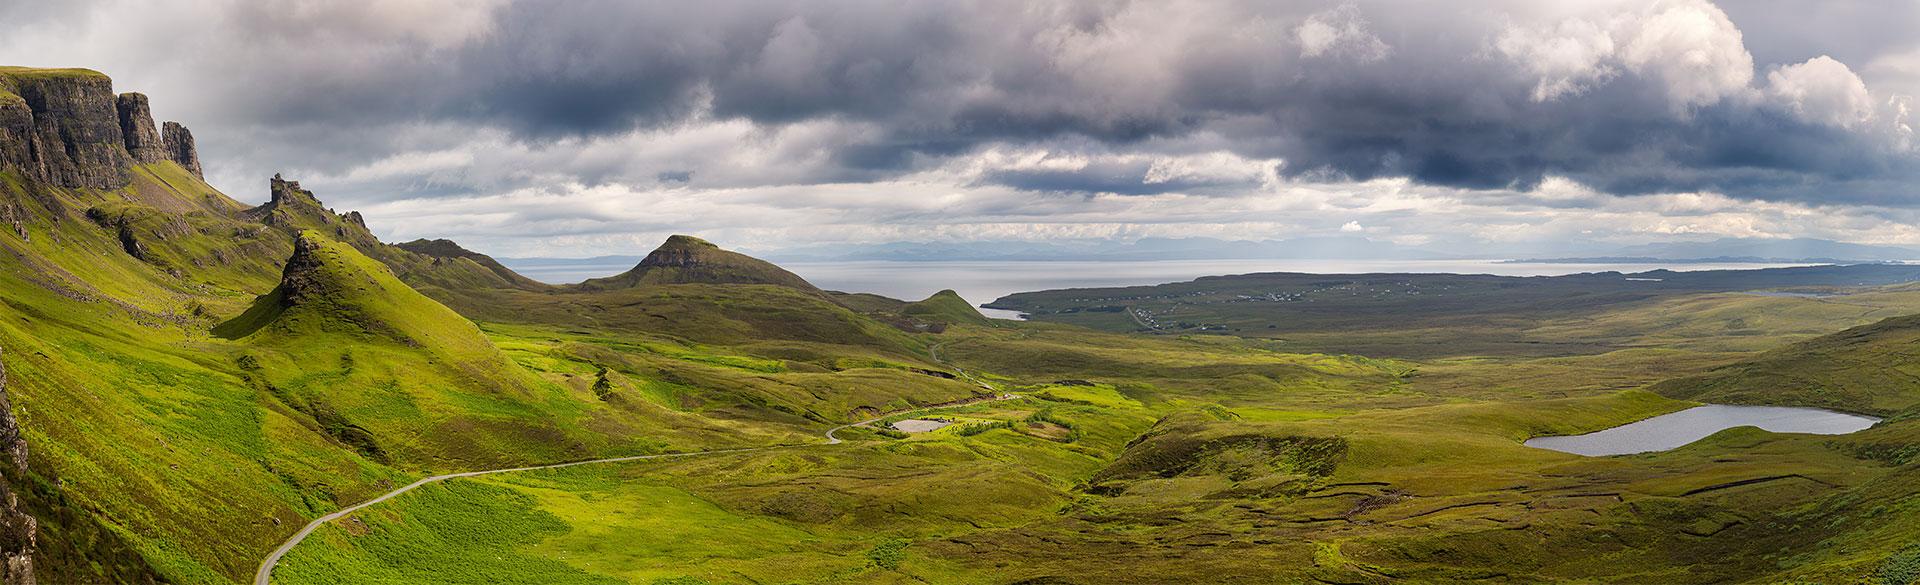
The Ben Nevis range from Corpach by TheTurfBurner via Geograph.org
What contour lines won’t show
Contour lines are not the whole story and there are limitations.
Vegetation: trees and plants can obscure smaller features, or disguise the shapes of larger ones, such as where only one side of a hill is wooded. If you are unsure, use an additional bearing to confirm your location.
Small features: some things can be hidden between contour lines. A 5m high cliff is too small to show up on many scales, but will effectively block your progress. Check for map markings indicating rocky outcrops.
Uneven slopes: while you can calculate the average slope, on the ground there can be a lot of variation, even if it is just the steep bank of a small stream. This will be most noticeable for cyclists, wheelchair users and when pushing prams. Often the only way to be aware of this in advance is to rely on notes or route descriptions.
This is part of our collection of free map reading guides for National Map Reading Week, which encourages everyone to improve their map reading skills and discover new adventures.