Learn all about contour lines
Learn the use and meaning of contour lines on a map and understand how to use them to when you’re out and about or planning routes. Understanding contours will improve your map reading skills.
Hills, slopes and mountains are represented on a map using contour lines. By studying the contour lines you can work out lots about the surrounding terrain including gradients of hills, valleys and steepness of climbs. If you already know the basics, check out our advanced guide to reading contours and relief.
Check out our Pathfinder guidebook titled Navigation Skills for Walkers which includes information on map reading, compasses and GPS.
How are hills and mountains shown on a map?
The ability to understand the shape of the ground from a map is a useful skill to learn, particularly in mountainous landscapes and when you are out and about hiking. Look for the height and shape of the ground which is shown on 1:25 000 scale maps (OS Explorer) by brown contour lines. A contour is a line drawn on a map that joins points of equal height above sea level. For 1:25 000 scale maps the interval between contours is usually 5 metres, although in mountainous regions it may be 10 metres.
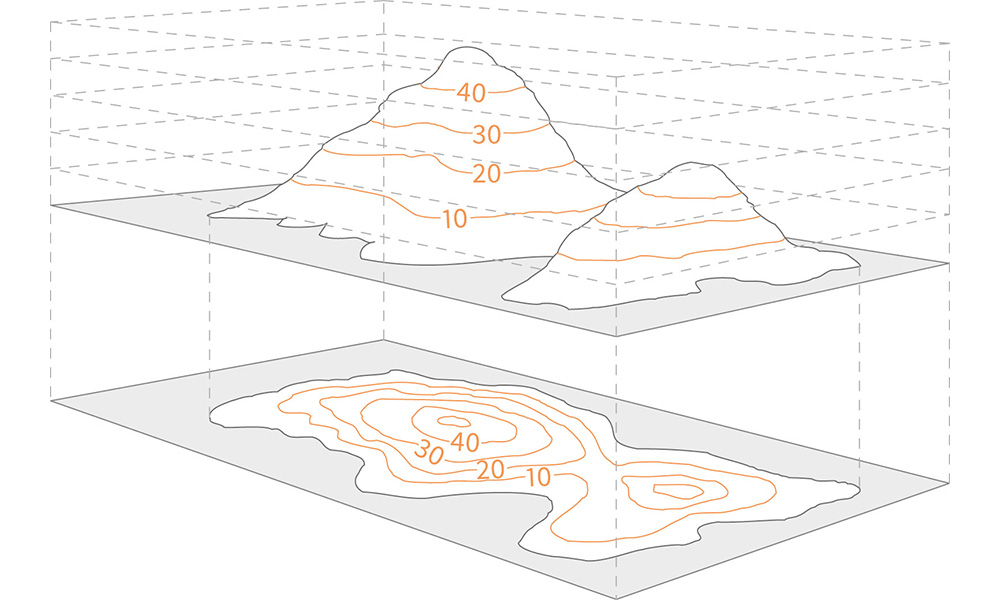
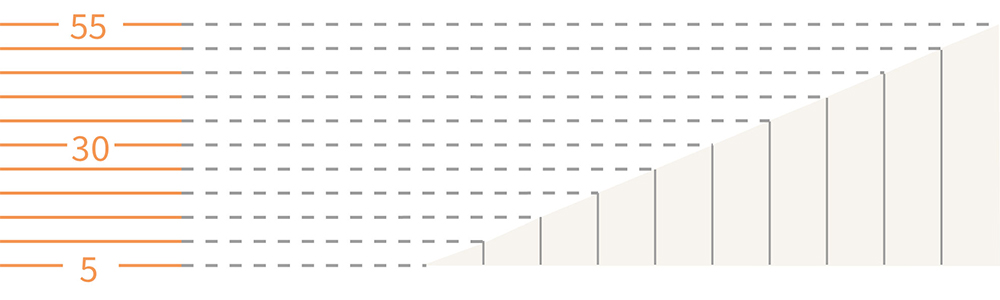
How contour lines show a pair of small hills
You can see from the picture above the link between the shape of a hill and the contours representing it on a map. Another way of thinking about contour lines is as a tide mark left by the sea as the tide goes out, leaving a line every 5 metres.
Top tip!
Remember contour numbering reads uphill – in other words the top of the number is uphill and the bottom is downhill. Also remember the closer contour lines are together, the steeper the slope.
How steep is the slope?
The steeper the slope the closer together the contour lines will be. You can see this in the examples below:
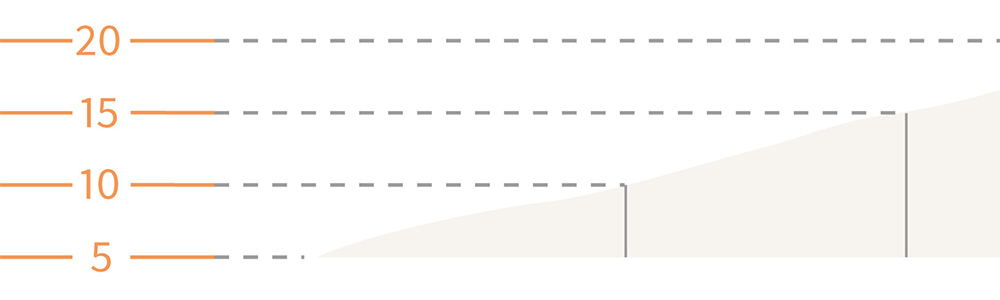
Shallow slope – contours are spaced well apart
Steep slope – contours are close together
Watch Steve Backshall explain contours
Putting it all together
Now you know how contour lines are created, you can use them to visualise the terrain they show, remembering that:
- Contours follow points of equal height. If you can’t see a number, follow the line to find one
- On some maps, not all contours will have labels and are printed slightly lighter, but you can work out the height by looking at labelled contours above and below
- The best way to understand contours is to practice by comparing a map to the real world or photographs
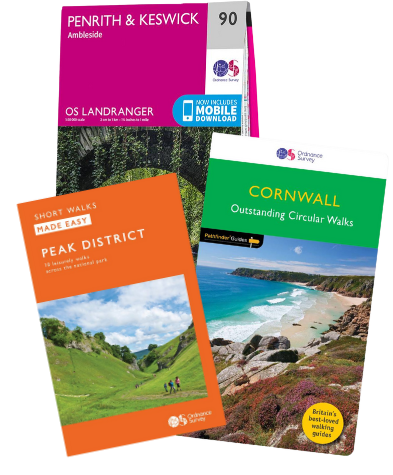
EXPLORE THE
OS Shop
We are with you every step of the way. Shop our trusted walking and hiking maps and guidebooks so you can explore the outdoors with confidence.
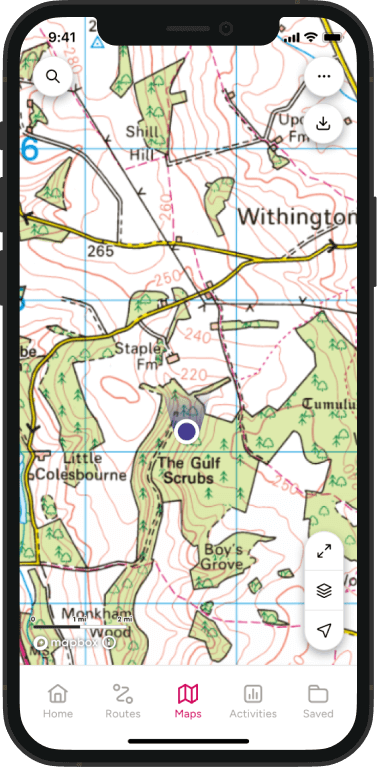
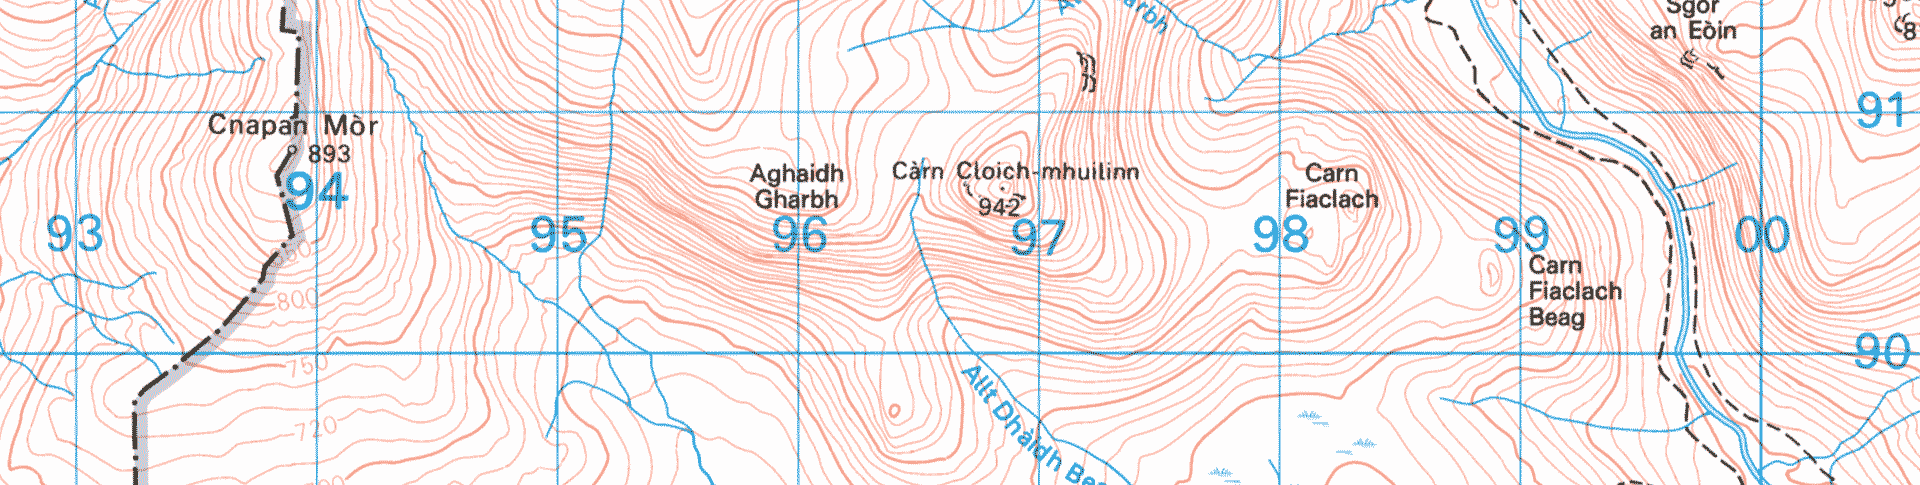
Go to the shopPractice map
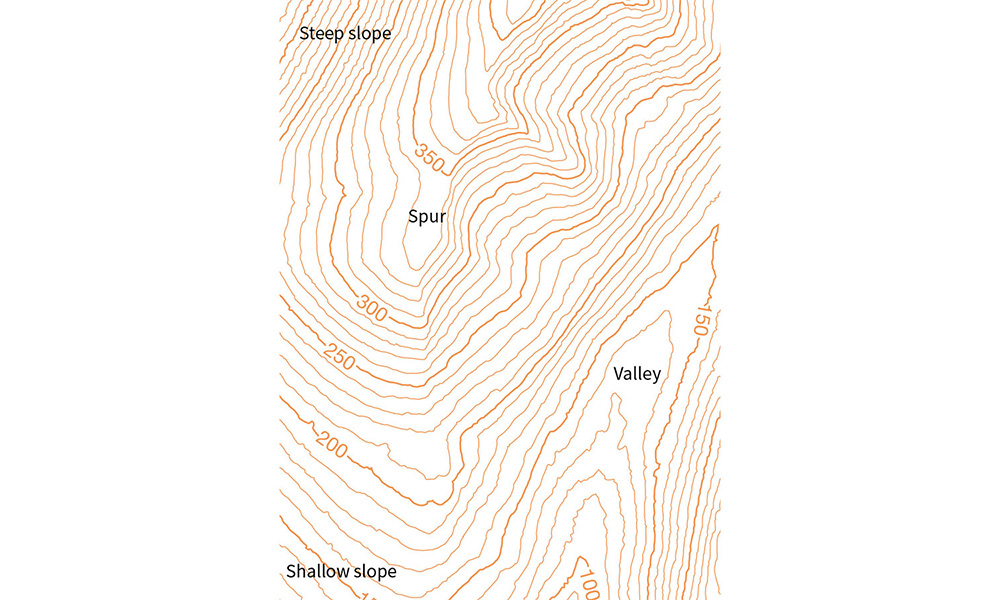
- The close together contours in the top left show a steep slope
- The spaced out contours in the bottom left show a shallow slope
- The upside down v-shape on the right is a small valley that also goes downhill from the top of the map to the bottom
- There is a hill peak just over 430m at the top centre of the map
- Near the middle of the map, at the 350m contour label, there is a flat area that’s a ridge or spur
Now that you have learnt the basics, you can further your knowledge with our advanced guide to reading map contours and relief.