How cartographers determine map scale
Understanding map scales is vital to successfully using maps for planning and navigation. Boost your map reading skills with this advanced guide for understanding Ordnance Survey map scales and key features on each OS map.
We’ve already written about the beginners guide to map scales. However, just understanding that a map shows features scaled down by the scale number is not the whole story. An important part is also understanding how cartographers create maps of different scales using a process called ‘generalisation’.
Generally surveys are carried out and initial maps are made in a large scale, such as 1:1250. However, as discussed in the earlier article these maps, while highly accurate, are not that useful for many purposes as they won’t show enough area. Cartographers take the large scale mapping information and change this to show small scale maps which are popular with walkers and cyclists.
Making a small scale map
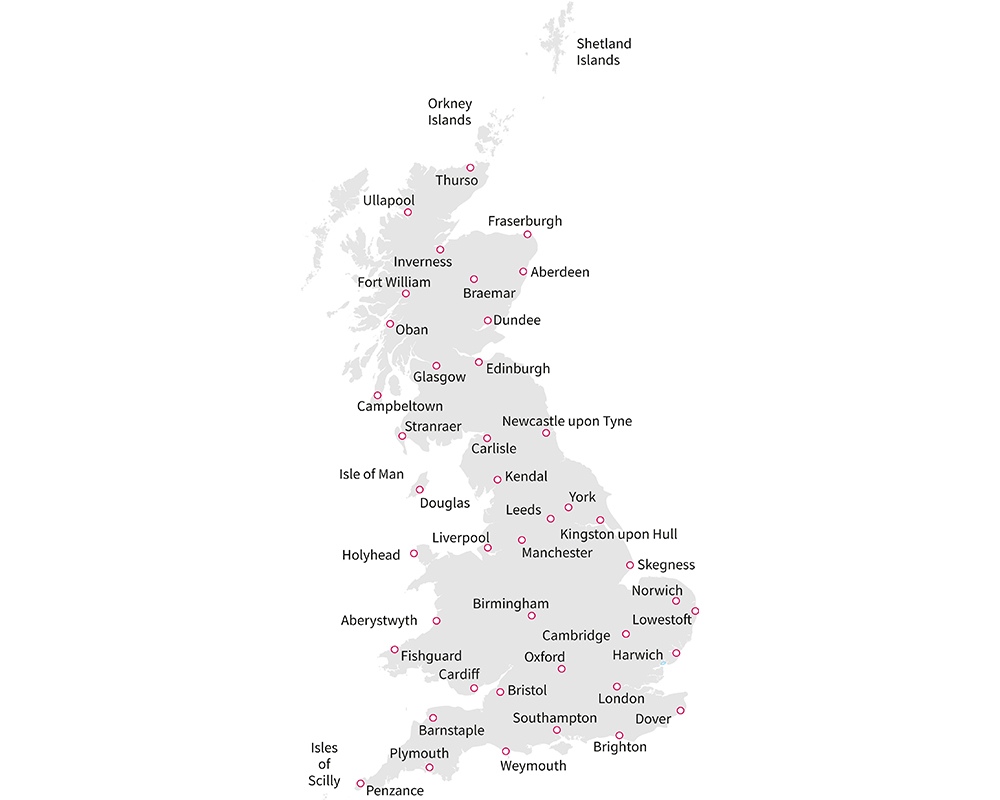
A small scale map of Britain with few features
To create an accurate picture of a landscape on paper everything has to be made much, much smaller. This is done by ‘scaling down’ the actual size of the land. This map shows Great Britain. The size of the island has been ‘scaled down’ to around 1: 6 000 000 (depending on your screen size!) so it will fit. The map is too small to contain a lot of detail, so only some cities and towns are shown,
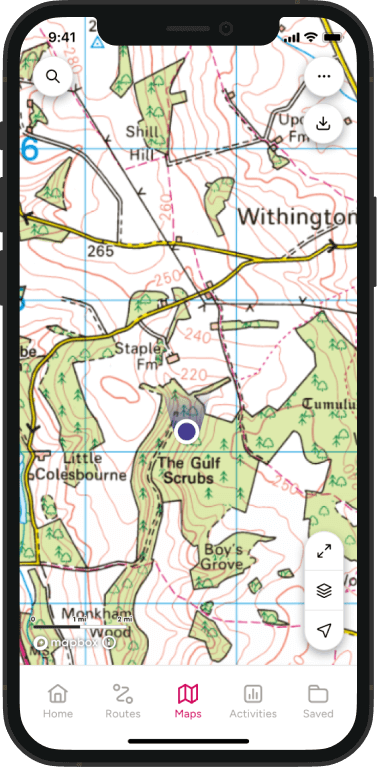
This is especially noticeable on digital maps, like OS Maps, where the amount of detail shown will change as you zoom in and out, with roads, villages or even entire cities disappearing when there is no longer the space to show them.
This is important for interpreting scale, as cartographers don’t just reduce detail. Features that are important may be deliberately shown considerably larger than they are to ensure that they remain visible.
This is often most noticeable on road maps. If you measured the width of a road and scaled it exactly, it would appear very small on a map – probably too small to distinguish easily. To compensate, cartographers oversize the width of the road.
Some features most maps don’t show to scale
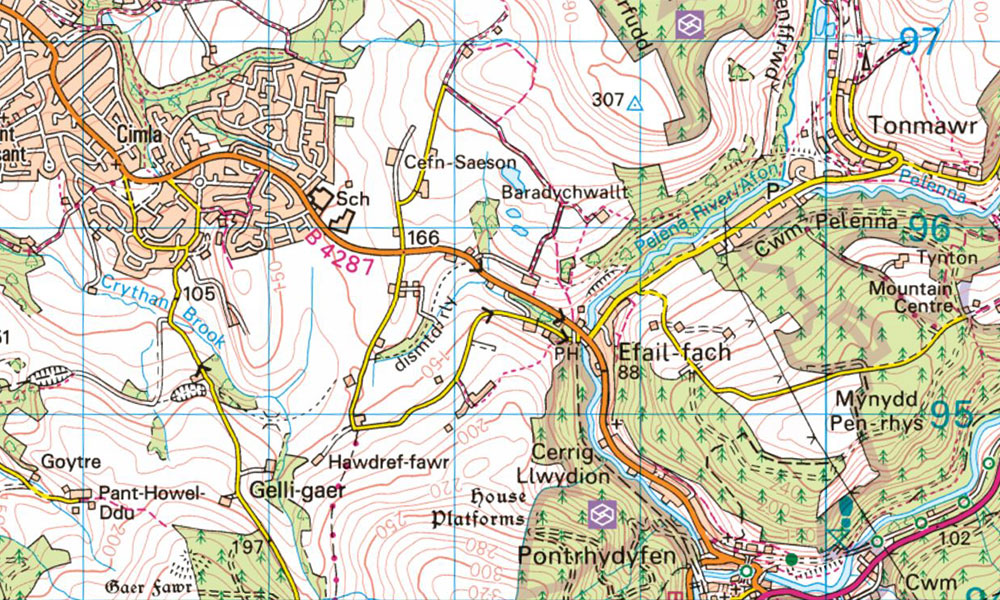
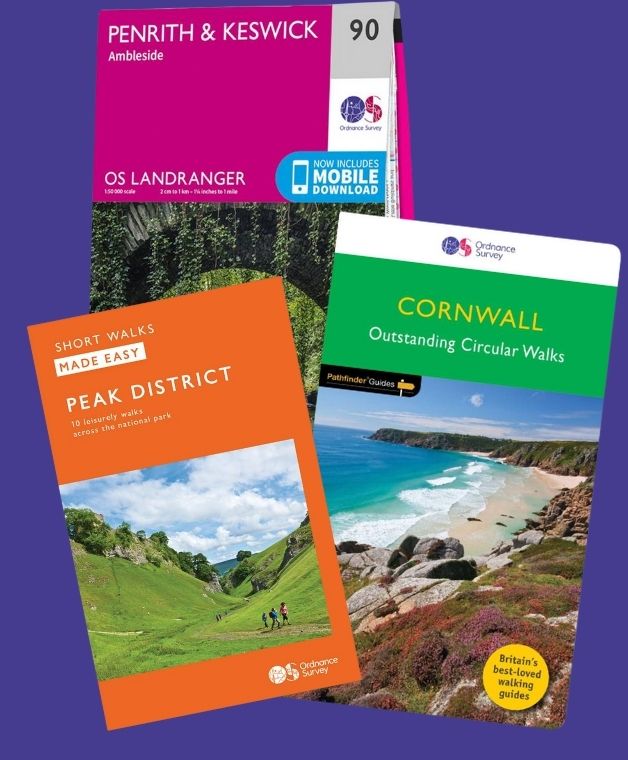
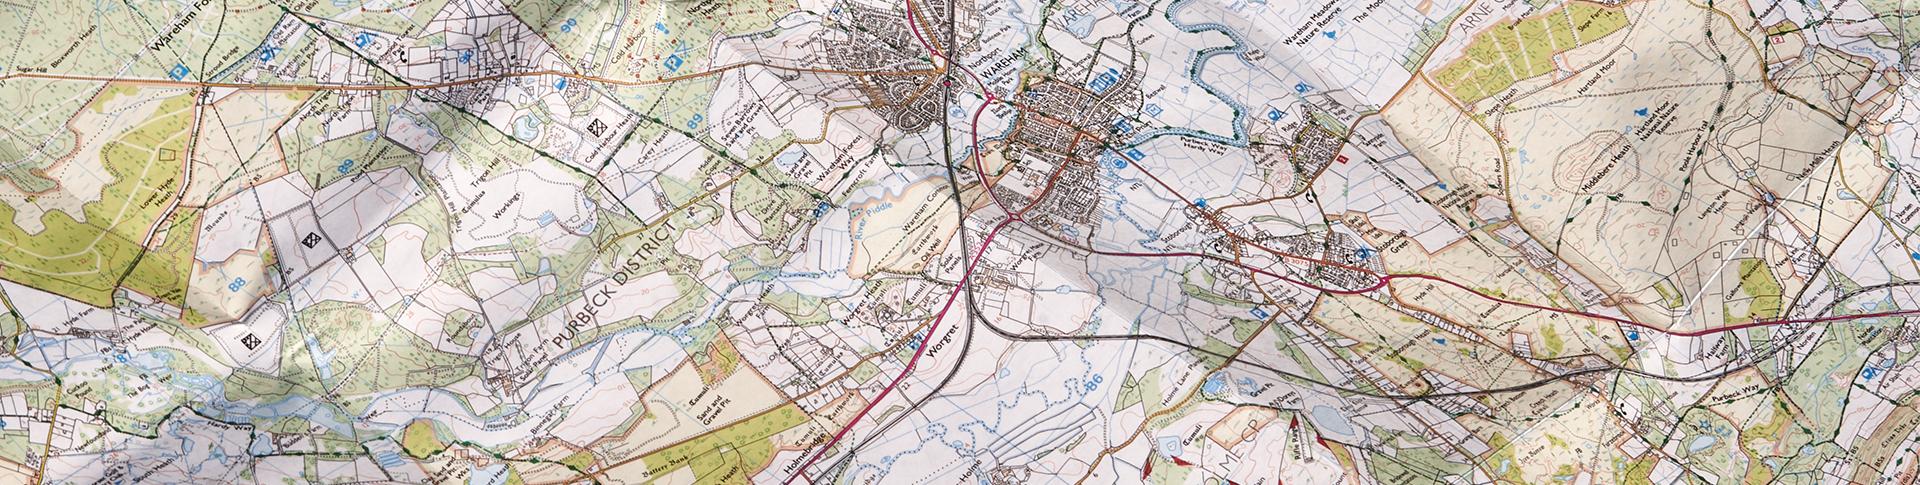
1: 50 000 scale on an OS Landranger map
Roads tend to be marked in different colours depending on the type of road depicted. Roads on a map range from thick blue lines, showing motorways, to dashed lines, indicating an unfenced minor road. Roads of the same type are normally shown at a fixed width, and are often shown larger than the scale to ensure they are clearly visible.
Footpaths are marked on Ordnance Survey maps in various colours. On a 1:25 000 scale OS Explorer map the public rights of way are marked in green; on a 1:50 000 scale OS Landranger map they are marked in magenta. On the ground a footpath can vary from as wide as a road down to a narrow squeeze, even changing throughout the year as vegetation grows and dies back.
Buildings are marked by small brown squares outlined in black to the approximate size and shape of the building. However, some particular buildings have their own special symbols, such as churches and windmills, which are useful landmarks are often shown with a special symbol larger than normal scale. Other smaller buildings, especially sheds and outhouses may be missing altogether if they are too small to show clearly.
Rivers and streams are shown as blue lines. The width of the line is representative of the watercourse width, but may not be exactly to scale to ensure smaller watercourses are still shown. A river more than 8 metres wide it is shown as two blue lines with a light blue area between. Of course, most waterways will change size depending on local rainfall.
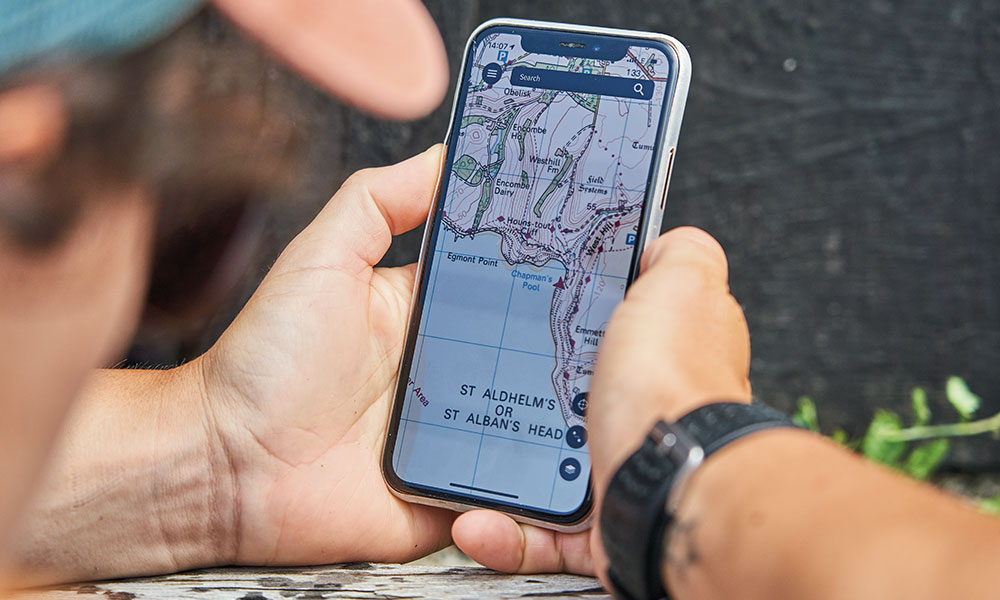
OS Maps app
Other cartographic tricks
Selection
All maps have an element of selection in them, where only relevant features are included. This is especially obvious on specialist maps where many of the usual features may be absent altogether to allow for room for more detail on others.
Combination
Two features that are close together may be combined at smaller scales into a single object. For example, named suburbs of cities may be merged into a single block with the city name where there is not room to show them individually.
Displacement
Sometimes there are several features that are important and that need to appear on the map, but are so close to each other that they would overlap. One or more of the features can be displaced, or moved slightly into a clear area. While this may not show the correct position, it is usually close enough for the purposes the map is intended for. On some maps, a displaced map symbol may be shown with a small line showing the true position.
Smoothing and Simplification
Often, complex shapes may be smoothed or simplified to make them easier to represent on a map, or to give a clearer shape. This can often apply to paths or roads, where the representation on the map is changed deliberately to make junctions or crossings clearer, or to smooth out sharp corners for a more pleasing visual effect. Multiple small changes to a path may be smoothed to make it easier to follow, but at the cost of being less accurate.
Measuring distances to scale
Measuring distances to scale
Being able to accurately measure distances on a map will help while route planning. Here’s three methods
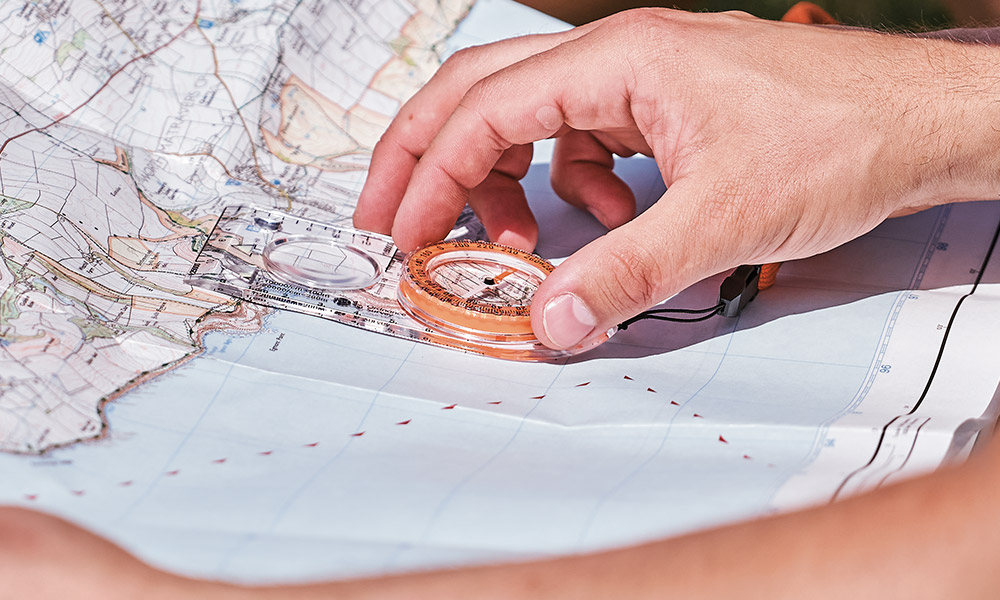
- Use a ruler (or romer) directly on the map. With a ruler, you will need to multiply by the map scale (tip: the text version of the scale ‘4 cm on the map equals 1 km’ is often easier to use). A romer is a special ruler which shows distances already converted for a specific scale, often found on the edge of a compass. Measure short sections in straight lines and add together to get the total distance.
- With a bit of string, carefully place the string on the route, then measure the amount of string you needed and multiply up by the scale.
- With a mechanical or digital map measurer, run the measurer along the route on the map, and then read the results to get the true distance. Map measurers will generally have a range of scales to choose from, so ensure you use one that matches the map scale
A measurement on a flat map does not take into account elevation changes. You may be covering more ground, especially if the slopes are steep. While it is possible to allow for this in your calculations, it is often far easier to add an approximation, so if a slope is 20 degrees, you would add about 2% to the distance.
The local terrain will also have an effect on the total distance, especially on footpaths, where the exact route can vary over time due to streams changing course, detours to avoid mud, vegetation growth and rockfalls. Your map will give an indication of the path, but it’s a good idea to allow 5 – 10% extra distance or time, especially on rougher terrain.
This advanced guide to understanding map scales is part of our collection of free Map Reading Guides celebrating National Map Reading Week, which encourages everyone to improve their map reading skills and discover new adventures.